EarMart Online Audiogram Generator
Free Online Audiogram and Hearing Test Report Generator Software by EarMart
Hearing care is moving online, and so is the paperwork that comes with it. Whether you run a busy audiology clinic, work as a hearing aid dispenser, or simply want to understand your own hearing results, a clear audiogram matters. Drawing graphs by hand or fighting with complicated desktop software wastes time. EarMart’s free online audiogram generator replaces that with a simple, browser-based tool that turns raw hearing thresholds into a clean, professional report in minutes.
This guide explains what an audiogram is, how an online hearing test report generator works, what to look for in audiogram software, and how to get the most from EarMart’s free tool.
What Is an Audiogram?
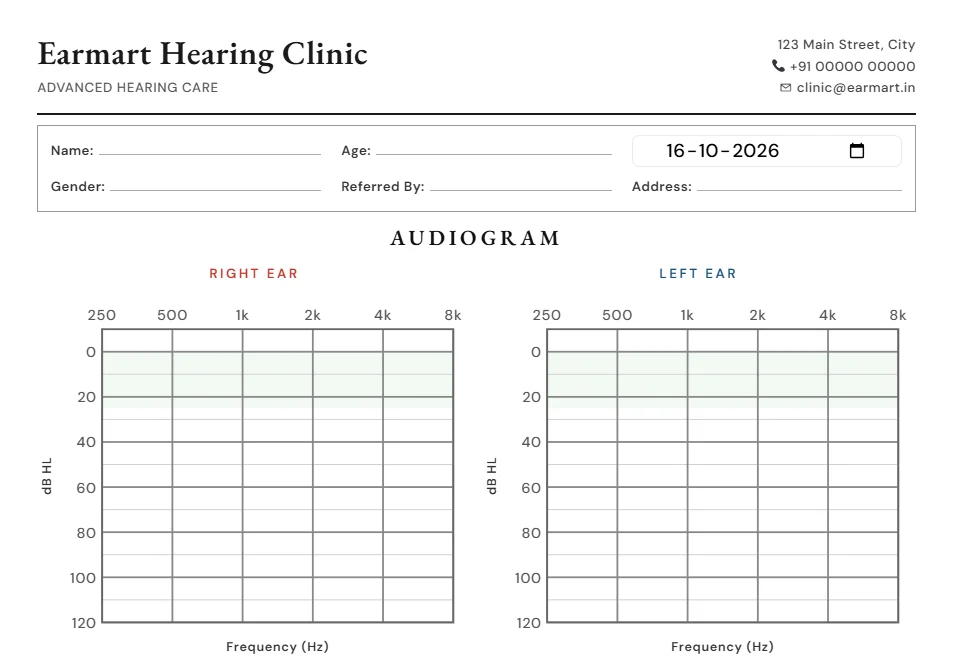
An audiogram is a graph that shows how well a person hears across different sound frequencies. It is the standard record produced after a pure tone hearing test. The horizontal axis shows frequency in hertz (Hz), usually from 250 Hz to 8000 Hz, moving from low-pitched sounds to high-pitched sounds. The vertical axis shows hearing level in decibels (dB HL), moving from soft sounds at the top to loud sounds at the bottom.
Each ear is plotted separately, with standard symbols. Red circles usually mark the right ear and blue crosses mark the left ear. Together, the plotted points show the softest sound a person can hear at each pitch. This pattern helps professionals identify the type, degree, and shape of hearing loss, and guides decisions about hearing aids, medical referrals, and follow-up care.
Why Use an Online Audiogram Generator?
Traditional audiogram creation has several pain points. Paper charts are slow to fill in and easy to smudge. Plotting errors can creep in when you are busy. Some desktop audiometry packages are expensive, tied to specific hardware, or too complicated for simple reporting needs.
An online audiogram generator solves these problems:
Speed: Enter threshold values and see the graph appear instantly.
Accuracy: Automated plotting reduces human error and keeps symbols consistent.
Accessibility: Use it from any device with a browser, with nothing to install.
Professional output: Reports look neat and consistent, which builds patient trust.
Zero cost: A free tool lets small clinics, students, and individuals work without a software budget.
Key Features of EarMart’s Audiogram Report Generator
EarMart built its online audiogram software to be practical for everyday use. Here is what you can expect from a quality hearing test report generator.
Simple Threshold Entry
You enter hearing thresholds for each frequency and each ear in a clean input form. There are no confusing menus or unnecessary steps, so even first-time users can finish a chart quickly.
Instant Audiogram Chart
Once values are entered, the tool plots a standard audiogram with the correct axes and ear symbols. The layout follows conventions that audiologists recognize, which makes results easy to read and compare.
Printable and Shareable Reports
A good audiogram is only useful if it can be shared. The generated report can be saved or printed for patient files, handed to patients, or sent to a doctor or hearing aid specialist for review.
Patient Details Section
Reports can carry patient information such as name, age, date of testing, and notes. This keeps records organized and makes each report self-explanatory.
Works on Any Device
Because the tool runs online, you can use it on a desktop in the clinic, a laptop during a screening camp, or a phone while traveling.
Free to Use
Quality audiogram software should not be out of reach. EarMart offers this generator free of charge so more people can document and understand hearing results.
How to Generate an Audiogram Online: Step by Step
Creating a report with EarMart takes only a few minutes.
Open the audiogram generator on the EarMart website.
Enter patient details, such as name, age, gender, and test date.
Add hearing thresholds for the right ear and left ear at each test frequency, typically 250, 500, 1000, 2000, 4000, and 8000 Hz.
Review the plotted graph to confirm the values look correct.
Add notes or observations, such as test conditions or recommendations.
Generate and save the report to print or share it.
Always double-check your numbers before finalizing. A single misplaced digit can change the picture of a person’s hearing.
How to Read an Audiogram
Understanding the chart is as important as creating it. Here is a simple guide.
Normal hearing: Thresholds fall between 0 and 25 dB HL across frequencies.
Mild hearing loss: Thresholds fall between 26 and 40 dB HL. Soft speech and background conversation become harder to follow.
Moderate hearing loss: Thresholds fall between 41 and 55 dB HL. Normal conversation is difficult without amplification.
Moderately severe hearing loss: Thresholds fall between 56 and 70 dB HL.
Severe hearing loss: Thresholds fall between 71 and 90 dB HL. Only very loud sounds are heard.
Profound hearing loss: Thresholds are beyond 90 dB HL.
Besides the degree, the shape of the line matters. A downward slope toward high frequencies often suggests age-related or noise-induced loss. A flat line suggests similar loss across all pitches. A rising pattern, with poorer low-frequency hearing, is less common and may need medical attention.
Ranges can vary slightly between classification systems, so professionals should always interpret results within their own clinical guidelines.
Who Can Benefit From This Tool?
Audiologists and ENT clinics: Produce consistent, professional reports without manual plotting.
Hearing aid dispensers: Document a customer’s hearing profile before fitting devices and keep it on record.
Students of audiology and speech therapy: Practice plotting and interpreting audiograms with instant visual feedback.
Health camps and screening programs: Generate quick reports for many people in the field.
Individuals: Convert hearing test results into a clear graph to better understand their own hearing before consulting a specialist.
Online Generator vs. Manual Charting
Manual charting is not wrong, but it is slower and less uniform. An online generator keeps every report in the same format, removes the risk of illegible handwriting, and saves minutes per patient, which adds up over a busy week. It also makes it easy to re-create a report if the original is lost, since you only need the threshold values.
Tips for Accurate Audiogram Reports
Make sure the hearing test itself is performed in a quiet environment with properly calibrated equipment.
Record thresholds carefully and verify entries before generating the report.
Use the correct ear designation, since swapping left and right is a common mistake.
Include the test date so future comparisons are meaningful.
Store reports securely and respect patient privacy at all times.
Remember that an online generator documents results. It does not replace a professional diagnosis.
An Important Note on Online Hearing Tests
An audiogram report is only as reliable as the test data behind it. A screening done with consumer headphones in a noisy room is not equal to a clinical test in a sound-treated booth. If you or someone you know has noticed difficulty hearing, ringing in the ears, sudden hearing changes, or ear pain, consult a qualified audiologist or ENT specialist rather than relying on any online tool alone.
Why Choose EarMart?
EarMart focuses on making hearing health tools simple and accessible. The audiogram generator is designed for clarity: fast entry, clean charts, and reports that look professional. It removes the cost and complexity that often keep small practices and individual users from producing proper audiograms.
Conclusion
A well-made audiogram is the foundation of good hearing care, and creating one should not be a chore. EarMart’s free online audiogram and hearing test report generator makes it easy to turn test results into accurate, professional reports in minutes. Whether you are a clinician looking to streamline your workflow, a student learning the basics, or a patient who wants to understand your results, this tool gives you a fast and dependable way to do it. Try it today and see how much simpler hearing reports can be.
Frequently Asked Questions (FAQs)
1. Is the EarMart audiogram generator really free?
Yes. You can create audiogram charts and hearing test reports online at no cost.
2. Do I need to install any software?
No. The tool runs in your web browser on desktop, tablet, or mobile.
3. Can this tool perform a hearing test for me?
No. It generates an audiogram report from threshold values you already have from a hearing test. For a proper test, visit a qualified audiologist.
4. Which frequencies can I enter?
You can enter standard audiometric frequencies, typically from 250 Hz to 8000 Hz, for both the right and left ears.
5. Can I print or share the generated report?
Yes. Reports can be saved or printed so they can be shared with patients, doctors, or hearing aid specialists.
6. Is this audiogram report a medical diagnosis?
No. It is a documentation tool. Diagnosis and treatment should always come from a licensed hearing healthcare professional.
7. Who should use an online audiogram generator?
Audiologists, ENT clinics, hearing aid dispensers, students, screening camps, and individuals who want a clear visual of their hearing results.