What Is an Audiogram? How to Read Results | EarMart
What Is an Audiogram? A Simple Guide to Understanding Your Hearing Test Results
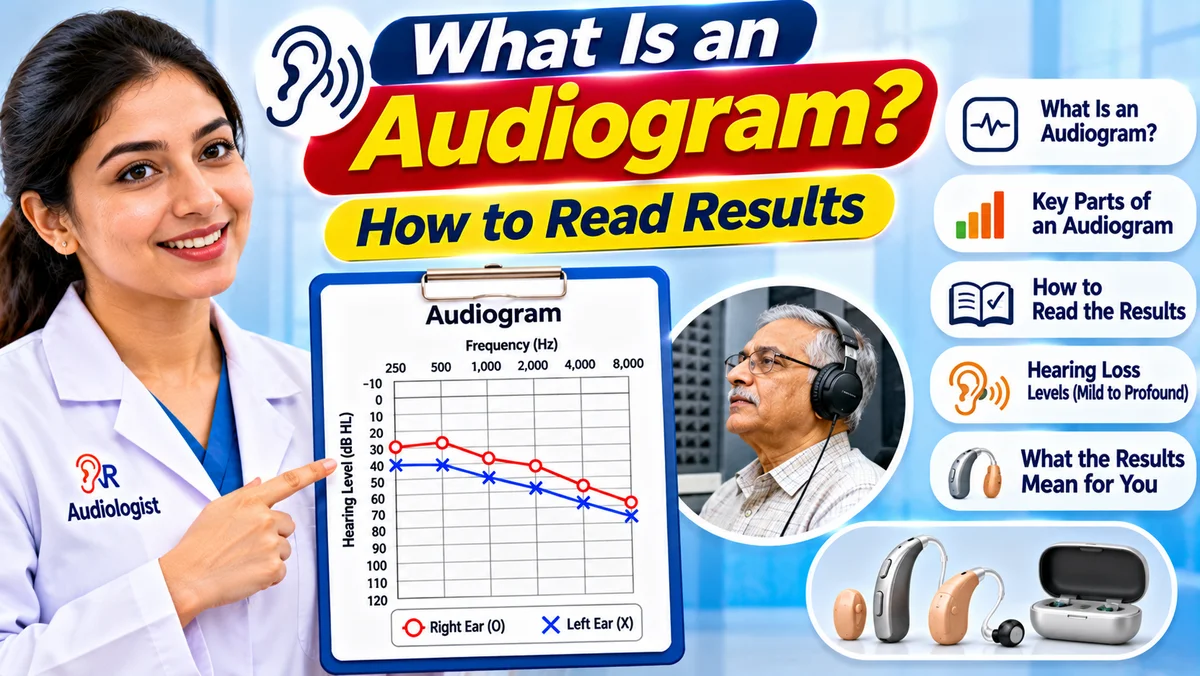
An audiogram is a chart that shows how well you hear. It is a core part of a complete hearing test, turning a series of simple listening exercises into a clear visual record of your hearing health. If you have ever wondered why conversations in busy restaurants feel like a struggle, or why certain voices and everyday sounds seem to fade, your audiogram can help explain what is going on.
At EarMart, we believe that understanding your results is the first step toward hearing better. This guide explains what an audiogram is, how it is created, how to read one, and what the results can mean for you.
What Is an Audiogram?
An audiogram is a graph that records the quietest sounds you can hear at different pitches. These quietest points are called hearing thresholds, and each one marks the softest level at which you can reliably detect a particular tone. By plotting your thresholds for each ear, the audiogram shows how your hearing compares with the typical range for healthy hearing.
Because it is visual, an audiogram makes it much easier for you and your audiologist to see whether hearing loss is present, which pitches are affected and how significant the difference is. No two audiograms are exactly alike, which is why it forms the foundation for personalised advice, from simple monitoring to hearing aids.
Why Does an Audiogram Matter?
An audiogram does far more than confirm whether you can hear a beep. It gives you and your hearing care professional:
An early warning of hearing loss, often before you notice symptoms yourself
A baseline to compare against future tests, so gradual changes are easy to spot
A clear explanation for everyday listening problems
A reliable guide for choosing and programming hearing aids when they are needed
Evidence that helps decide whether a medical referral is appropriate
Good hearing supports relationships, confidence, safety and an active lifestyle, so knowing where you stand is well worth a short appointment.
How Is an Audiogram Created?
Your audiologist or audiometrist builds your audiogram from the results of several simple, painless tests performed during a hearing assessment. Most people find them relaxed and straightforward.
Pure tone testing. You wear headphones and listen to a series of beeps at different pitches and volumes. Each time you hear a tone, however faint, you press a button or raise your hand. This measures the softest sounds you can detect across the frequencies that matter most for everyday communication.
Bone conduction testing. A small vibrating device is placed on the bone behind your ear, known as the mastoid. Sound travels through the bone directly to the cochlea, the inner ear organ that converts vibration into signals for the brain, bypassing the outer and middle ear. Comparing these results with the headphone results helps show whether any hearing loss originates in the outer or middle ear, or in the inner ear.
Speech audiometry. Hearing a sound and understanding words are not the same thing. In a speech test, recorded words are played at different volumes and you repeat what you hear. This shows the quietest level at which you can hear and understand speech, and how clearly you make out words.
Some assessments also include extra checks, such as testing how well the eardrum and middle ear are moving, to complete the picture.
How to Read an Audiogram
Your hearing care professional will always walk you through your results, but reading an audiogram is easier than it looks. There are two axes to understand.
The Vertical Axis: Loudness
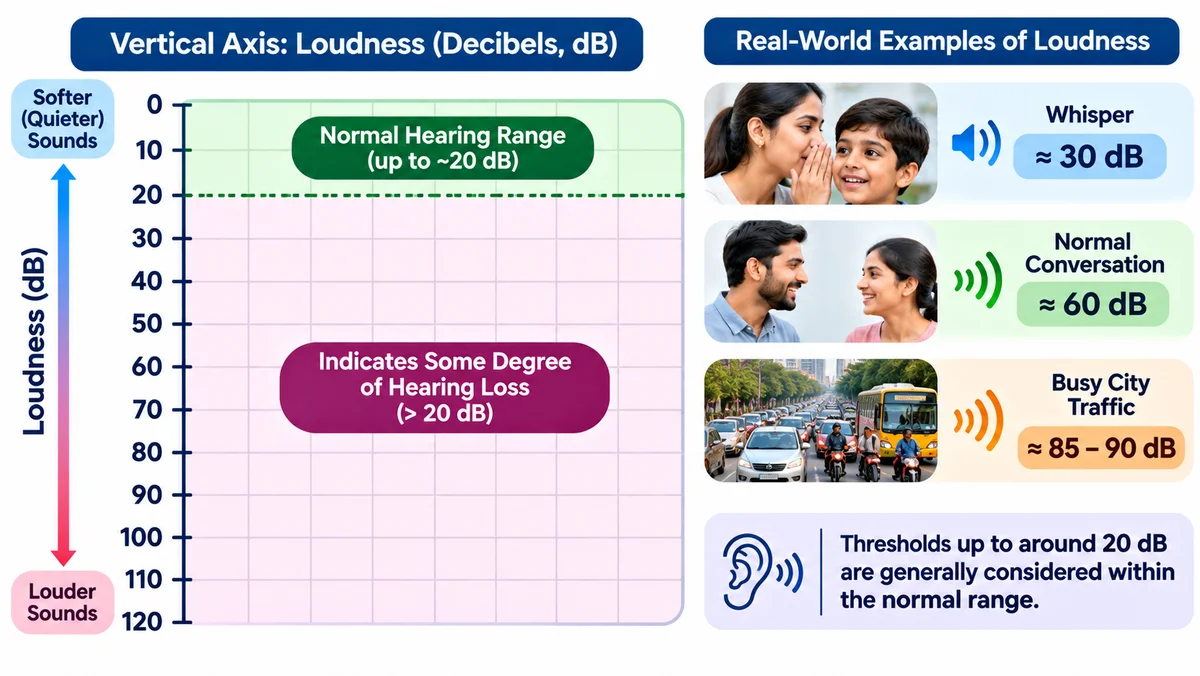
The vertical axis shows loudness, measured in decibels (dB). The numbers get larger as you move down the chart, so a mark placed lower means a sound had to be louder before you could hear it. To put the numbers in context, a whisper is about 30 dB, normal conversation about 60 dB and busy city traffic roughly 85 to 90 dB. Thresholds up to around 20 dB are generally considered within the normal range. Marks below that line point to some degree of hearing loss.
The Horizontal Axis: Pitch
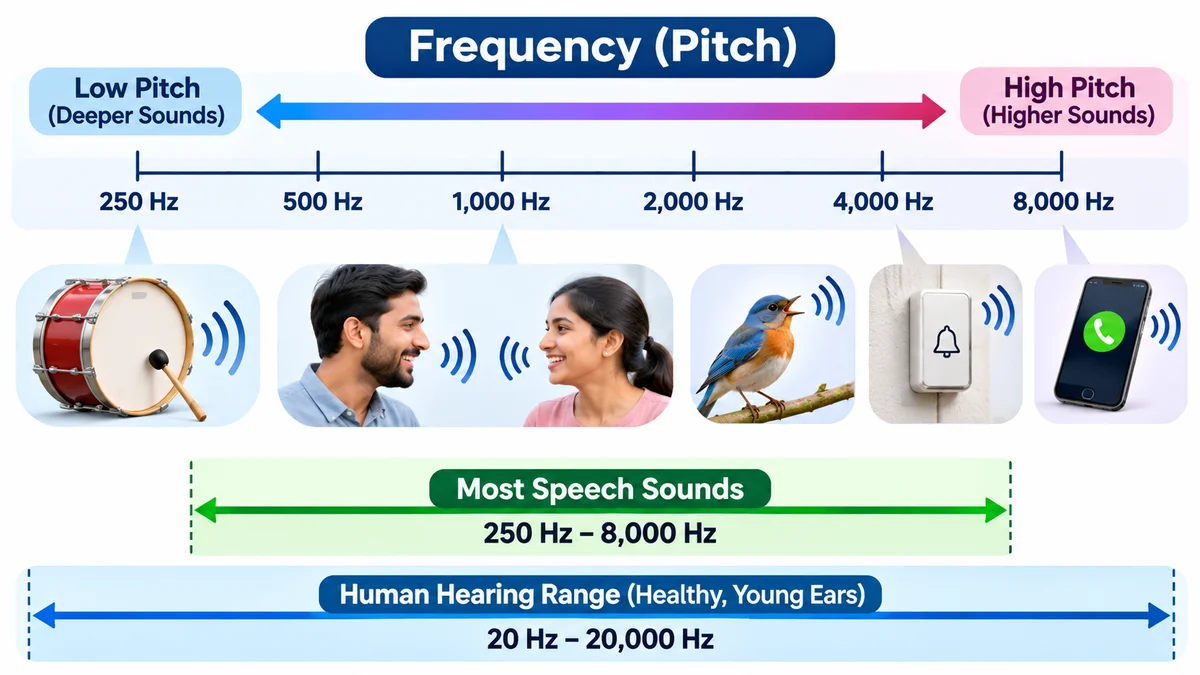
The horizontal axis shows frequency, or pitch, measured in hertz (Hz). Low pitches sit on the left and high pitches on the right. A deep drum or bass note might be around 250 Hz, while high-pitched sounds such as birdsong, a doorbell or a ringing phone sit toward 2,000 to 8,000 Hz. Healthy young ears can detect roughly 20 Hz to 20,000 Hz, but most speech sounds fall between 250 and 8,000 Hz, so that is the range tested on an audiogram.
Symbols and Lines
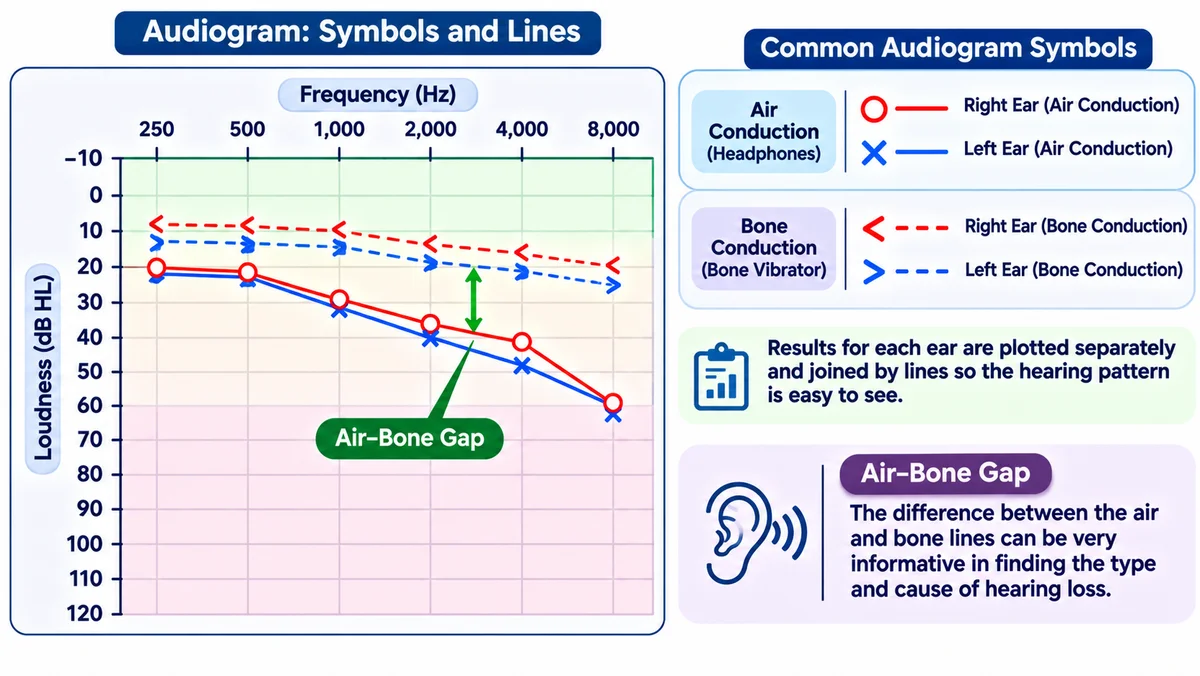
Your results for each ear are plotted separately. By common convention, red circles represent the right ear and blue crosses represent the left ear, joined by lines so patterns are easy to see. Bone conduction results use different symbols, and the gap between the air and bone lines can be very informative.
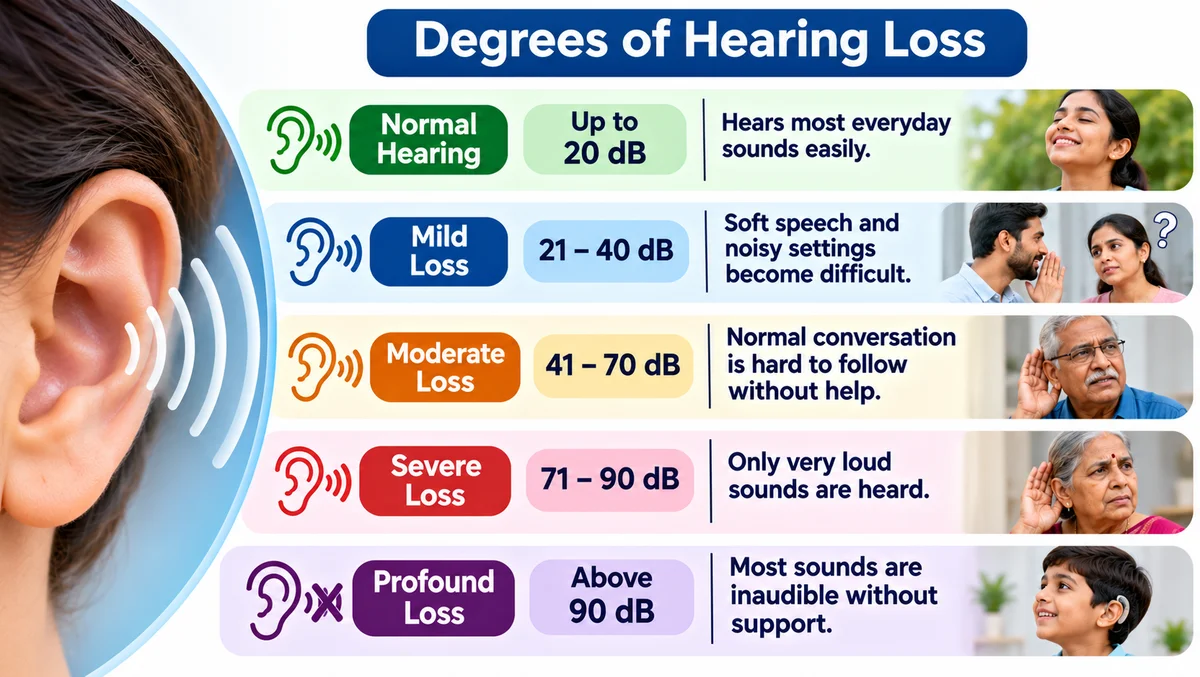
Understanding the Degrees of Hearing Loss
Hearing loss is usually grouped by how loud a sound must be before you hear it. Exact boundaries vary slightly between organisations, but a common guide is:
Normal hearing: up to about 20 dB
Mild loss: about 21 to 40 dB, where soft speech and noisy settings become difficult
Moderate loss: about 41 to 70 dB, where normal conversation is hard to follow without help
Severe loss: about 71 to 90 dB, where only very loud sounds are heard
Profound loss: above 90 dB, where most sounds are inaudible without support
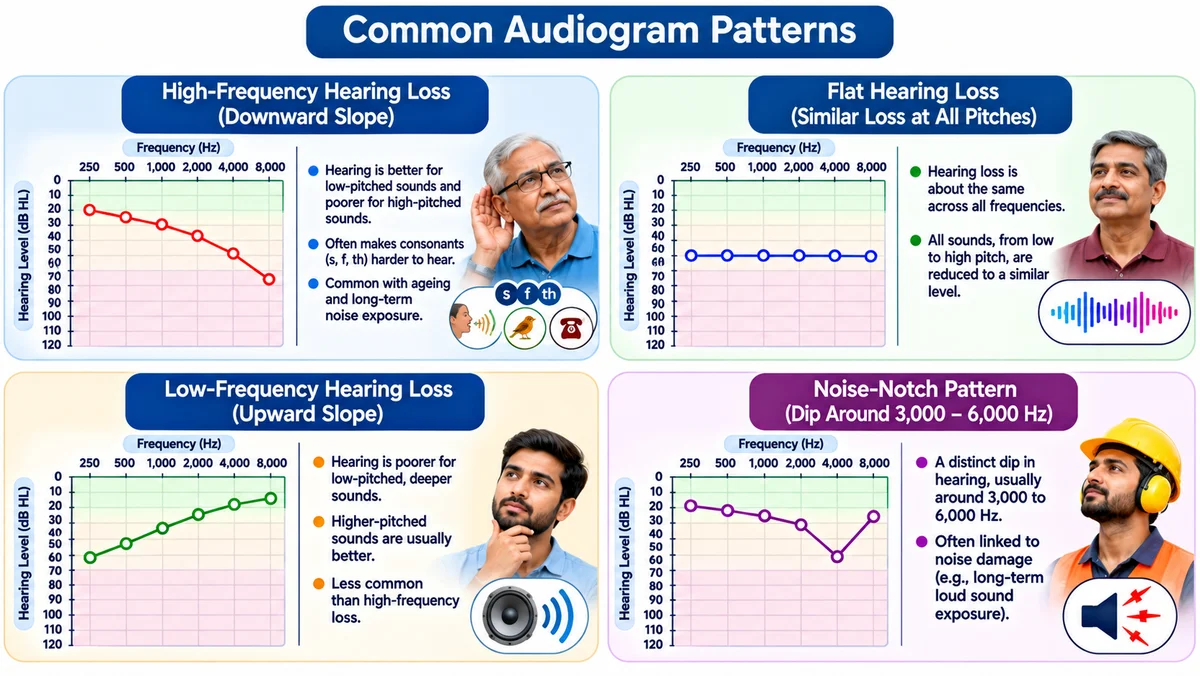
Common Audiogram Patterns
The shape of your audiogram says as much as the numbers. A line that slopes downward toward the right shows high-frequency hearing loss, the most common pattern. People with this pattern often hear voices but struggle to make out consonants such as s, f and th, and may miss children’s voices, birdsong or a ringing phone. It is often linked with ageing and long-term noise exposure. A flat pattern shows similar loss across all pitches, while low-frequency loss is less common and affects deeper sounds. A dip around 3,000 to 6,000 Hz is often associated with noise damage.
What Happens After Your Audiogram?
Once your audiogram is complete, your audiologist will explain what it shows in plain language and talk through your options. Depending on your results, recommendations may include:
Regular monitoring if your hearing is healthy or changes are minor
Medical review if results suggest a problem in the outer or middle ear
Hearing protection if noise exposure is a concern
Hearing aids programmed to your exact audiogram when hearing loss is confirmed
Modern hearing aids are discreet, comfortable and very effective, and your audiogram is the blueprint used to tailor them to your needs.
When Should You Book a Hearing Test?
Consider an audiogram if you often ask people to repeat themselves, turn the TV up louder than others prefer, find speech muffled, notice ringing in your ears or avoid noisy social situations. Even without symptoms, a baseline test is a smart habit as you get older or if you work or play in loud environments. If you ever experience sudden hearing loss in one or both ears, seek medical attention urgently rather than waiting for a routine appointment.
Take the First Step With EarMart
An audiogram is a simple, comfortable way to understand your hearing and protect your quality of life. At EarMart, our hearing care team will guide you through each step, explain your results clearly and recommend solutions that suit your lifestyle. Book your hearing assessment with EarMart today and take control of your hearing health.
FAQs
What is an audiogram in simple terms?
An audiogram is a graph that shows the softest sounds you can hear at different pitches. It lets your audiologist see at a glance whether your hearing is normal or reduced, and in which ear and at which pitches.
Is an audiogram test painful?
No. The tests are painless and non-invasive. You listen to tones through headphones, feel a gentle vibration behind the ear and repeat some words.
How long does an audiogram take?
The listening tests often take around 20 to 30 minutes. A full assessment, including a discussion of your results, may take a little longer.
What does a normal audiogram look like?
A normal audiogram shows thresholds within about 20 dB across the tested frequencies, roughly 250 to 8,000 Hz, for both ears. The marks sit near the top of the chart.
Can I get an audiogram from an online hearing test?
Online tests are useful screening tools, but they cannot replace a proper audiogram. A clinical audiogram uses calibrated equipment, a controlled quiet environment and a trained professional to interpret the results.
How often should I have my hearing tested?
It depends on your age, noise exposure and previous results. Many adults benefit from a baseline test and a repeat every one to three years, or sooner if you notice any change in your hearing.
Does an audiogram show the cause of hearing loss?
An audiogram shows the type, degree and pattern of hearing loss. These findings help point toward likely causes, but your audiologist may recommend further tests or a medical review to confirm them.